12 Key Statistics in as Many Games for the OKC Thunder

The Oklahoma City Thunder are halfway through their four-game West Coast trip, their longest road trip of the season.
Despite the injuries this team has already dealt with, few teams have gotten off to a better start to the 2026-27 season than Oklahoma City before arriving in Portland. The Thunder have lost as many games in Portland as they have all season. The losses have taught a lot, along with Oklahoma City’s other ten games this season.
Instead of providing the traditional stats available on NBA.com, today the statistics provided by Cleaning The Glass (a website referenced and used for advanced metrics) to break down matchups and identify key areas. Cleaning The Glass excludes garbage time and possessions at the end of quarters, and measures statistics per 100 possessions instead of per game.
Here are 12 things learned about the Thunder through as many games.
Statistical Facts We’ve Learned From the Thunder so Far
Offensive & Defensive Rating
Per Cleaning The Glass, the Thunder are 17th in the NBA in points scored per 100 possessions at 113.8, 16th in points scored per 100 possessions in the half court at 95.5, seventh in points allowed per 100 possessions at 109.5 and eighth in points allowed per 100 possessions in the half court at 92.0. Oklahoma City is 11th in efficiency differential at +4.3.
Offensive Efficiency
The Thunder are shooting 62.1% at the rim this season. That ranks second-to-last in the NBA.
The Thunder are shooting 42.2% from mid-range (16th).
The Thunder are shooting 35.6% from three (15th). 29.2% from the corners (26th) and 37.7% from non-corners (6th).
For instance, 34.1% = the league’s worst team from three last season (the Brooklyn Nets).
Shot Making vs Shot Selection
eFG% = Shotmaking – Adjusting for the extra point from threes, what did the team effectively shoot from the field?
Location eFG% = Shot Selection – If this team shot league average from each location where they are taking shots, what would their effective FG% be?
Based on where their shots are coming from on the floor, if they shot league average, their eFG% would be 53.6%
The Thunder’s actual eFG% is 51.8%, which ranks 23rd in the NBA.
Oklahoma City is taking good shots but they are well below league average in rim efficiency and around league average in the midrange and from three to start the season.
Now, rim efficiency is probably going to increase due to having one of the premier drivers and finishers, compared to the three-point shooting due to personnel.
Effectiveness on the Glass
Oklahoma City is 16th in offensive rebounds at 11.6 per game; the Thunder’s 14.1 second-chance points rank 22nd. They’re 13th in putback points allowed per 100 missed field goals (16.6), 17th in allowed putback plays generated per 100 missed field goals (15.0), and 15th in points allowed per 100 putback plays (107.6), according to Cleaning The Glass.
The Thunder are 13th in opponent offensive rebound percentage (30%).
Final Thought
The conclusion has been reached. After laying out the key statistics, that Oklahoma City is performing nowhere near the standard they have grown accustomed to over the last few seasons and has quite the battle ahead of it, which is understandable given its current reality.
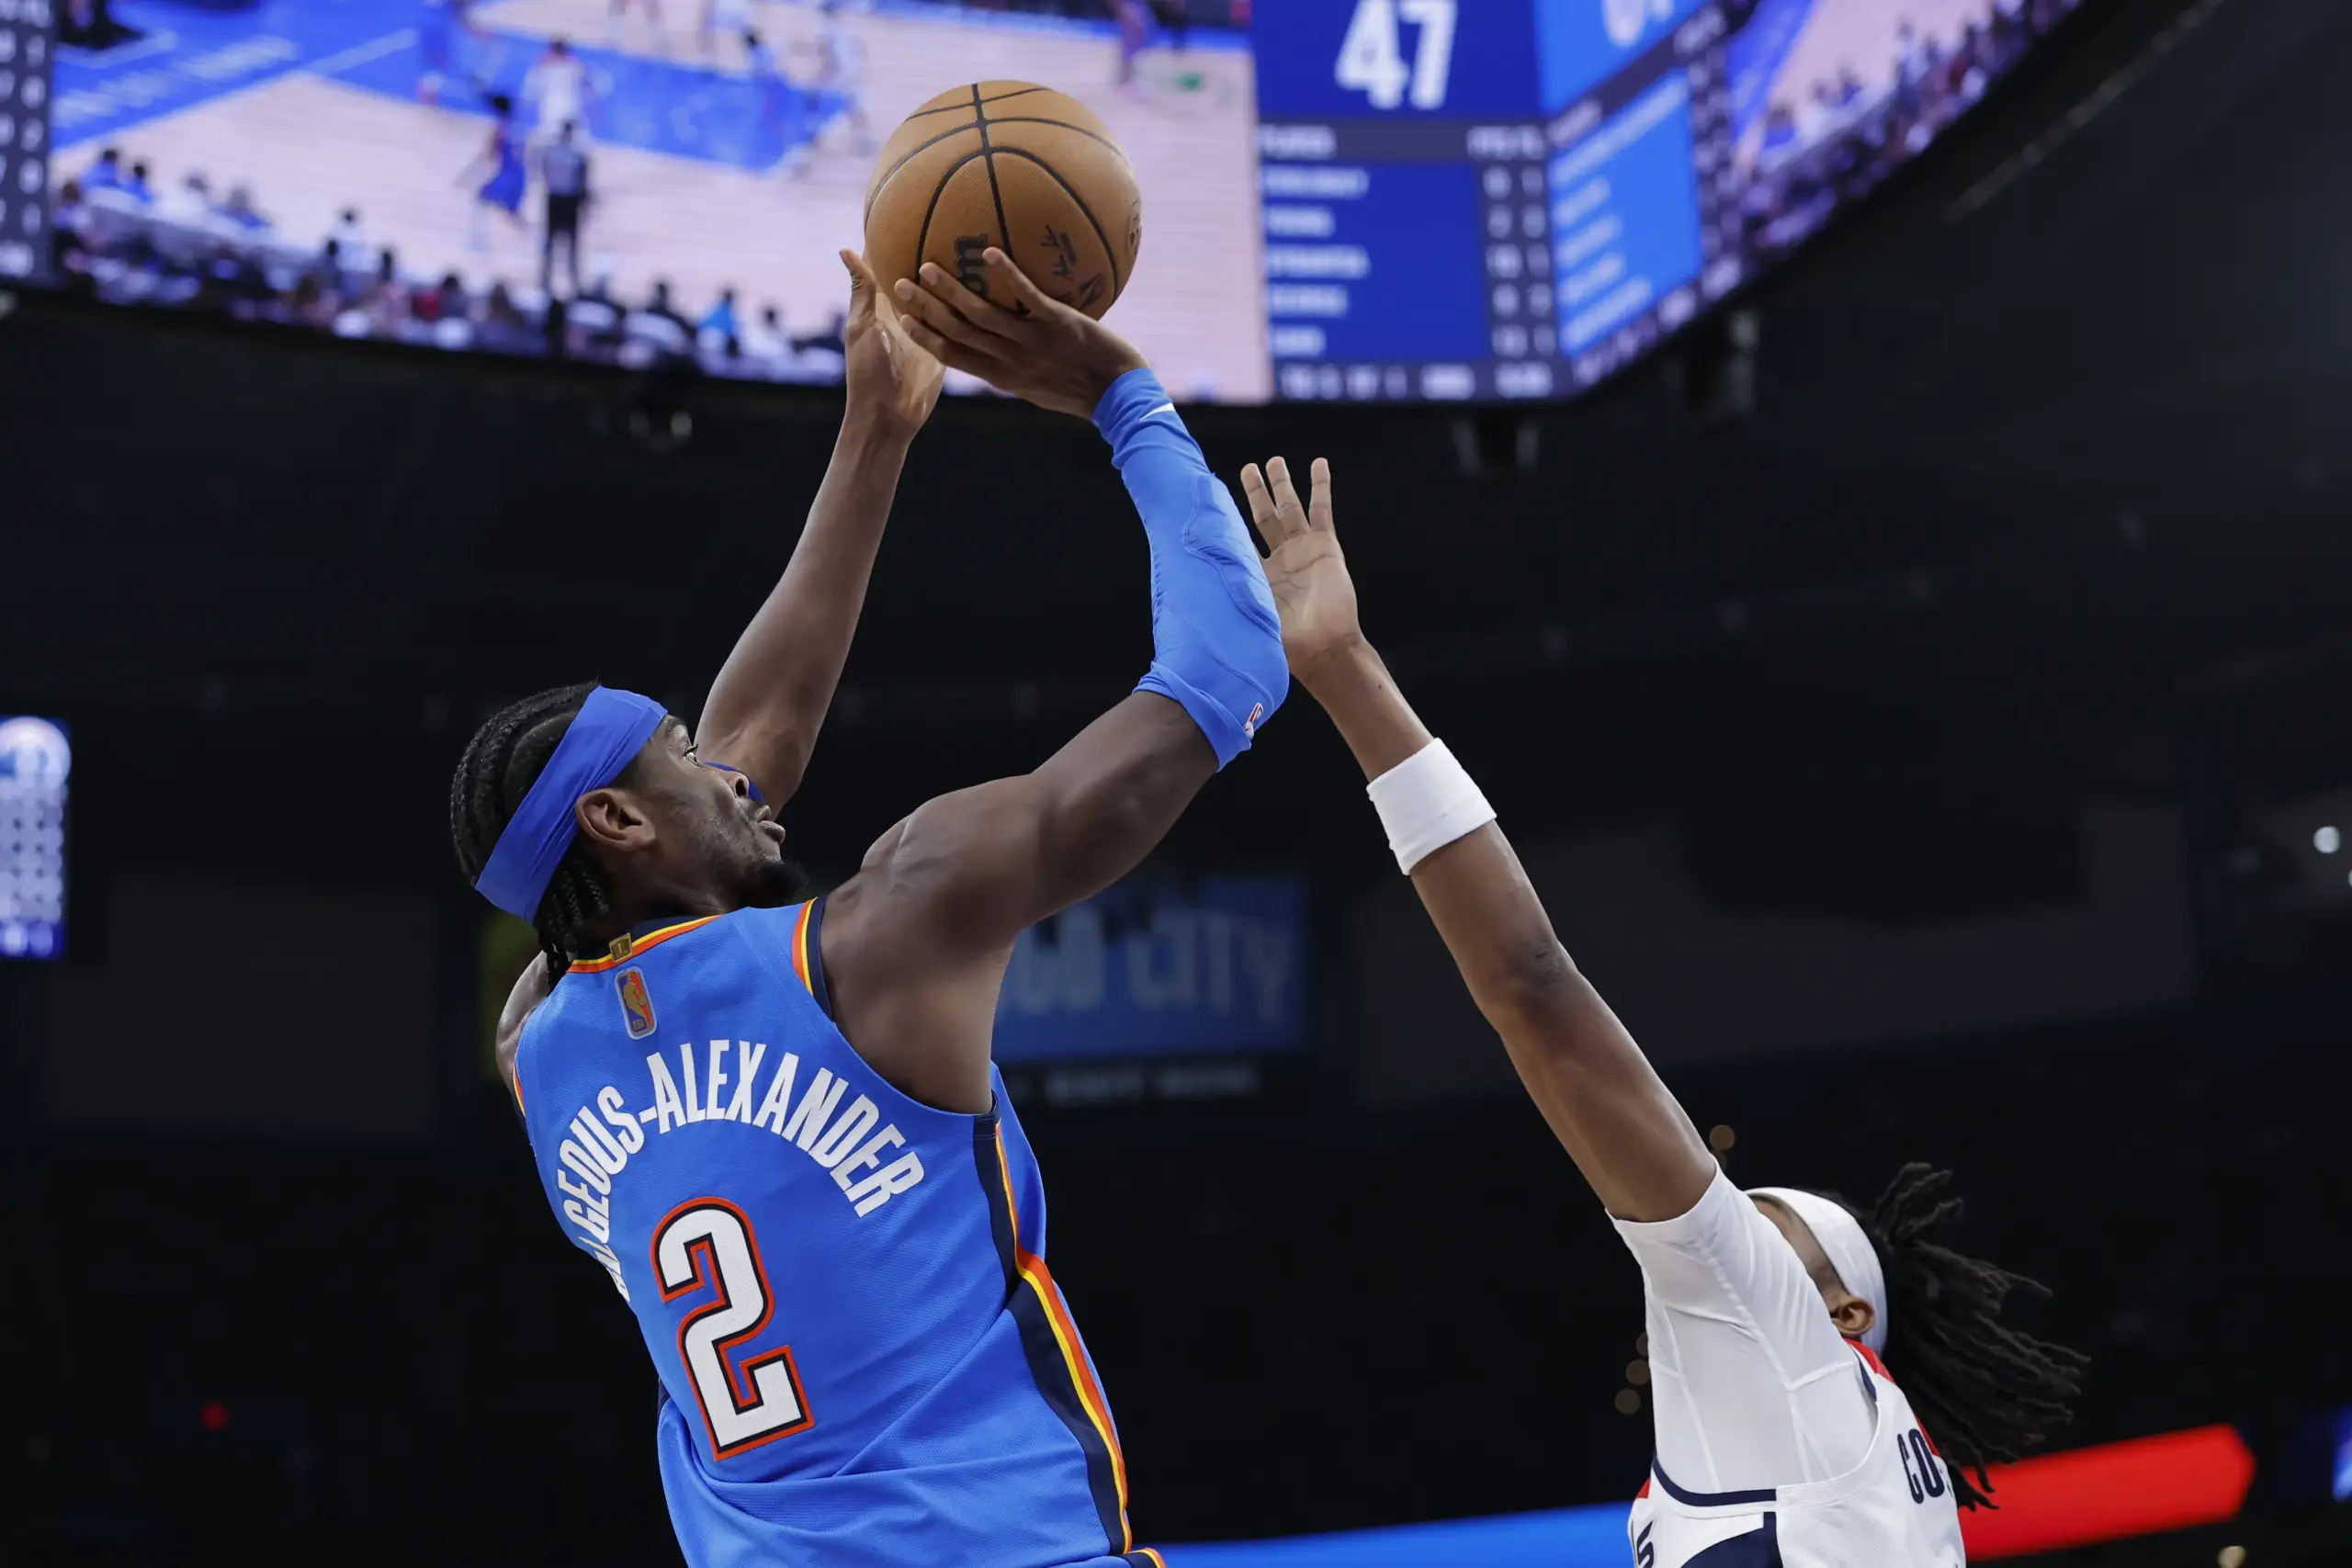
Main Image: Alonzo Adams-Imagn Images