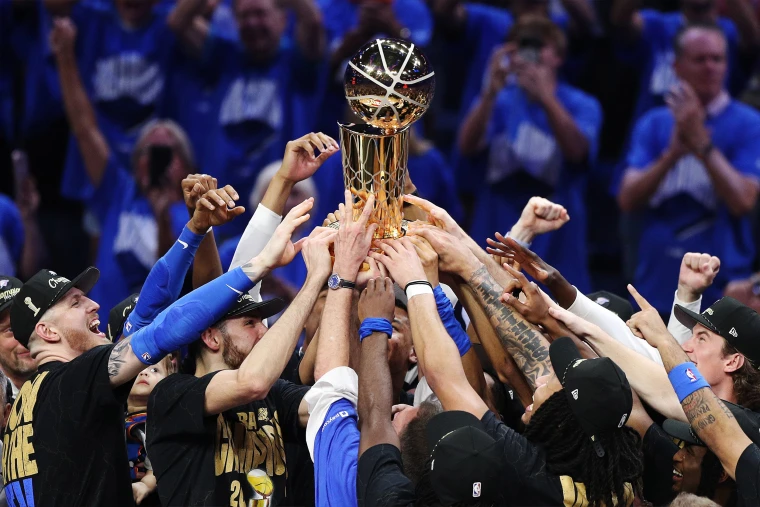
The 2025 NBA Finals delivered a dramatic seven-game series between the Oklahoma City Thunder and the Indiana Pacers, with OKC clinching their first title in franchise history. Beyond the highlight-reel dunks and buzzer-beaters, a handful of key stats defined the course of this championship. For fans following every play — whether courtside or on platforms like OMG Casino — understanding the numbers behind the game adds a whole new level of appreciation. Here’s a breakdown of five critical metrics that decided the outcome.
Stats That Ultimately Decided the NBA Finals
1. Turnover Rate
Turnovers can make or break a team’s momentum, especially in high-stakes Finals games. Here’s how they impacted this series:
- Pacers’ turnover rate: ~22% in the Finals (up from ~11.8% in the regular season)
- Game 1 stat: 19 turnovers in the first half alone
The Pacers’ inability to protect the ball gave the Thunder 10–12 extra possessions per game. These extra opportunities often led to quick transition points, which shifted momentum rapidly in several games. OKC’s defensive pressure was relentless, disrupting Indiana’s offensive rhythm.
2. Bench Scoring
Depth often separates good teams from great ones. The Thunder’s bench delivered consistent firepower:
- Thunder bench average: ~28.4 PPG
- Pacers bench average: ~13 PPG
OKC’s bench consistently outperformed Indiana’s, maintaining intensity and energy when starters rested. In Game 6 especially, the bench unit contributed over 30 points, allowing OKC to dominate the second half.
3. 3-Point Efficiency
The three-point shot continues to define modern basketball. Here’s how shooting beyond the arc shaped the series:
- Thunder Game 5 3PT%: 43.8% (including 15/22 from starters)
- Pacers average 3PT%: around 28–30%
Shooting from beyond the arc proved to be a major differentiator. The Thunder’s hot hands from deep opened up the floor, spacing the defense and enabling driving lanes. In tight games, this efficiency translated to 12–20 point swings.
4. Free Throw Attempts & Efficiency
Foul shots may seem routine, but they played a pivotal role in OKC’s title run:
- Thunder average FTAs: 28.6 per game
- FT shooting percentage: 85.2%
- Free throw differential: Thunder +10 FTAs per game
Aggressive play led to foul trouble for the Pacers and easy points for OKC. These consistent trips to the line allowed the Thunder to pad their lead, control the pace, and force Indiana into rotation issues.
5. Defensive Pressure
Defense doesn’t always show on the scoreboard, but its effects were undeniable:
OKC’s defense, particularly on the perimeter, caused havoc for Indiana’s ball handlers. Star players like Tyrese Haliburton struggled to find rhythm. The Thunder used switches and traps effectively, leading to turnovers and missed shot opportunities. Their hustle and communication disrupted Indiana’s offensive sets repeatedly.
Stats at a Glance
To summarize the statistical gap between the two teams:
| Stat Category | Thunder | Pacers | Differential | Game Impact |
| Turnover Rate | ~11% regular | ~22% Finals | +11% (Pacers) | Extra 10–12 possessions per game |
| Bench Points | ~28.4 PPG | ~13 PPG | +15.4 | Energy boost, Game 4 & 6 swing |
| 3PT % (Game 5) | 43.8% | ~28–30% | +13–15% | Opened floor, key runs |
| Free Throw Attempts | 28.6 per game | ~18 per game | +10 FTA advantage | Control tempo, foul trouble for Pacers |
| Defensive Pressure | High intensity | Broken rhythm | — | Forced errors, limited star efficiency |
What These Stats Teach Us
Each of these metrics highlights a crucial basketball principle. Here’s what coaches, fans, and analysts can take away:
- Possession Advantage Wins Games — More chances = more points.
- Depth Is Critical — Benches shift momentum and rest starters.
- Efficiency = Title Runs — Clean shooting and FTs separate contenders.
- Defense Creates Offense — OKC turned stops into fast-breaks.
Final Thoughts
The 2025 NBA Finals weren’t decided by just talent — they were won through discipline, depth, and execution. Oklahoma City proved that modern championship teams must excel statistically across key areas: shooting, turnovers, depth, and defense. These five metrics weren’t just numbers; they were the DNA of a title run.
Sources: ESPN, SBNation, Basketball Reference, Reuters game reports.


